
Plik:South Africa 2011 dominant language map.svg

Wielkość pliku podglądu PNG dla pliku SVG: 684 x 599 pikselōw Inksze rozdzielczości: 274 x 240 pikselōw | 548 x 480 pikselōw | 876 x 768 pikselōw | 1168 x 1024 pikselōw | 2337 x 2048 pikselōw | 809 x 709 pikselōw.
Ôryginalny zbiōr (Zbiōr SVG, nōminalnie 809 × 709 pikselōw, srogość zbioru: 798 KB)
Ôpis
| Ôpis |
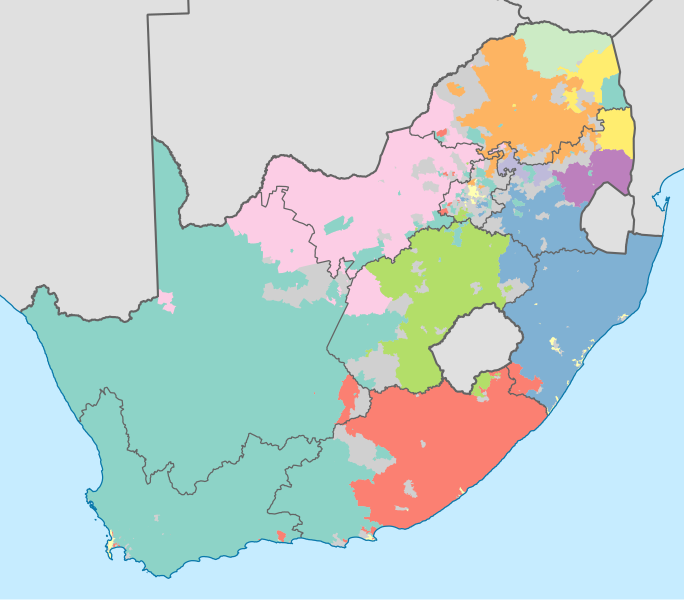
English: Map showing the dominant home languages in South Africa, based on ward-level data from the 2011 census. In this context, a language is dominant if it more than 50% of the population in a ward speak it at home, or more than 33% speak it and no other language is spoken by more than 25%.
English
Afrikaans
isiNdebele
isiXhosa
isiZulu
Sesotho sa Leboa
Sesotho
Setswana
siSwati
Tshivenda
Xitsonga
No language dominant
Projection is Albers Equal-Area Conic, with standard parallels at 25.5° S and 31.5° S, and origin at 28.5° S 24.5° E. |
| Data | |
| Zdrzōdło | Statistics South Africa's Census 2011 is the source of the basic population data. The map results from my own processing of the data. For ward boundaries see File:South Africa electoral wards 2011 blank.svg. |
| Autōr | Htonl |
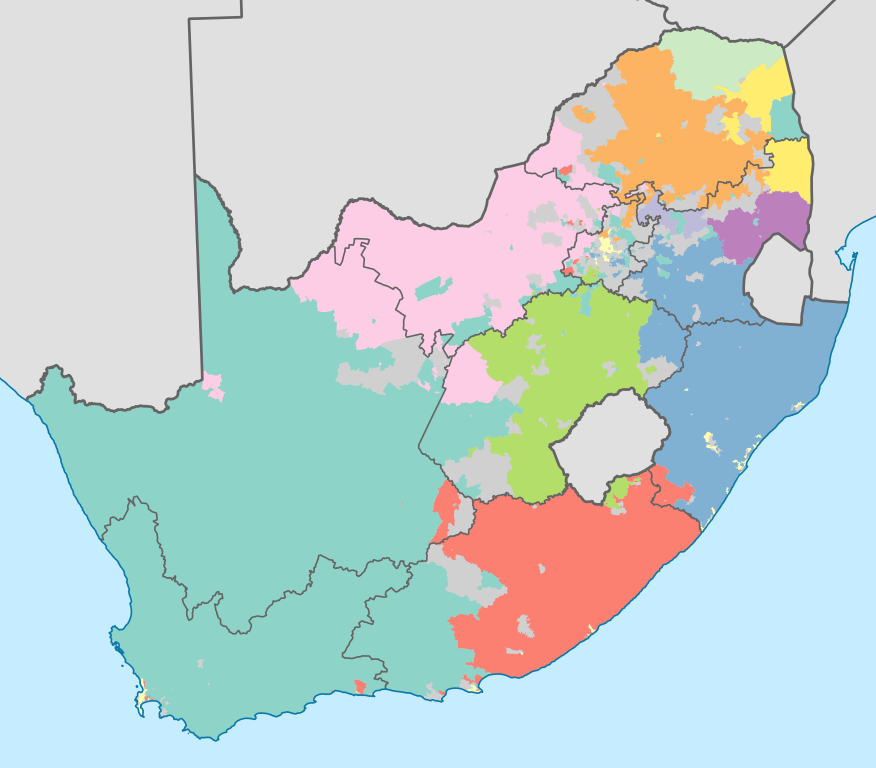
| Inksze wersyje |
South Africa 2011 dominant language map (hex cells).svg: .svg) |
Licyncyjŏ
The following license applies to the population data on which the map is based:

|
Właściciel autorskich praw majątkowych do tego pliku, Stats SA, zezwala każdemu wykorzystać go w dowolnym celu, pod warunkiem, że wykorzystujący wyraźnie wskaże autora. Redystrybucja, wykonywanie prac pochodnych, użycie komercyjne oraz każde inne są dozwolone. |
Uznanie autorstwa:
"the user acknowledges Stats SA as the source of the basic data wherever they process, apply, utilise, publish or distribute the data, and also that they specify that the relevant application and analysis (where applicable) result from their own processing of the data" [1]
|
The following tag applies to the map itself:
| Ja, właściciel praw autorskich do tej pracy, udostępniam ją jako własność publiczną. Dotyczy to całego świata. W niektórych krajach może nie być to prawnie możliwe, jeśli tak, to: Zapewniam każdemu prawo do użycia tej pracy w dowolnym celu, bez żadnych ograniczeń, chyba że te ograniczenia są wymagane przez prawo. |
Gyszichta zbioru
Kliknij w datã/czas, żeby ôbejzdrzeć zbiōr, jak wtynczŏs wyglōndoł.
| Data i czas | Miniatura | Wymiary | Używŏcz | Kōmyntŏrz | |
|---|---|---|---|---|---|
| terŏźnŏ | 23:09, 18 lis 2012 | | 809 × 709 (798 KB) | Htonl | =={{int:filedesc}}== {{Information |Description={{en|1=Map showing the dominant home languages in South Africa, based on ward-level data from the 2011 census. In this context, a language is dominant if it more than 50% of the population in a ward speak... |
Użycie zbioru
Ta strōna używŏ tego zbioru:
Globalne użycie zbioru
Tyn zbiōr je używany tyż we inkszych projektach wiki:
- Użycie we af.wikipedia.org
- Użycie we cs.wikipedia.org
- Użycie we de.wikipedia.org
- Użycie we dsb.wikipedia.org
- Użycie we en.wikipedia.org
- Użycie we eo.wikipedia.org
- Użycie we frr.wikipedia.org
- Użycie we fr.wikipedia.org
- Użycie we fr.wiktionary.org
- Użycie we he.wikipedia.org
- Użycie we it.wikipedia.org
- Użycie we ka.wikipedia.org
- Użycie we ko.wikipedia.org
- Użycie we lb.wikipedia.org
- Użycie we ml.wikipedia.org
- Użycie we mzn.wikipedia.org
- Użycie we no.wikipedia.org
- Użycie we pt.wikipedia.org
- Użycie we rm.wikipedia.org
- Użycie we ro.wikipedia.org
- Użycie we ru.wikipedia.org
- Użycie we sh.wikipedia.org
- Użycie we simple.wikipedia.org
- Użycie we sr.wikipedia.org
- Użycie we ss.wikipedia.org
- Użycie we sv.wikipedia.org
- Użycie we sw.wikipedia.org
- Użycie we te.wikipedia.org
- Użycie we tg.wikipedia.org
- Użycie we tr.wikipedia.org
- Użycie we uk.wikipedia.org
- Użycie we xh.wikipedia.org
- Użycie we zh.wikipedia.org
- Użycie we zu.wikipedia.org